Establishing an Early CO2 Storage Complex in Kemper County, Mississippi (ECO2S): Numerical Modeling Report
本报告总结了CarbonSAFE项目ECO2S Kemper地区储存综合体的储层模拟研究,以了解如何开发和运营该项目,接受从三个发电厂捕获和运输的每年2250万吨二氧化碳。这些来源是拉特克利夫工厂(年二氧化碳排放量为0.7百万吨)和丹尼尔工厂(每年3.0百万吨),以及米勒工厂的燃煤机组(每年18.8百万公吨),30年内二氧化碳排放总量为22.5百万吨/年或6.75百万吨。
由于二氧化碳的量如此之大,根据目前的地质认识,本工作集中于羽流将如何发展以及它可能如何运移。更令人感兴趣的是,是否可以通过使用水循环技术的主动羽流管理来最小化和/或更快固定羽流的大小和方向。利用最新的咸水储层地质解释成果、下塔斯卡卢萨区块砂层、瓦希塔弗雷德里克斯堡-丹茨勒和“大弗雷德”小层以及帕洛西小层,建立了基础模拟模型。从三口二期井收集的数据被纳入地质模型中,以便在项目现场进一步完善。利用测井和岩心数据为这些储层组开发了孔隙度-渗透率转换函数。
对水平渗透率各向异性和滞后捕集气体饱和度的敏感性分析显示了它们对羽流大小的影响,在CO2注入结束30年后,与基础模型假设相比,羽流大小变化了27%。该模型还研究了水循环,以了解其对控制羽流运移的影响。测试了与二氧化碳注入井相距一定距离和现场不同侧向的注水井和生产井的位置。位于四个井场上的十二口采水井(每个储层组有四口)每天可抽取20000桶水。然后,12口注入井通过储层的另一部分重新注入产出水。在注入二氧化碳的同时开始,并在二氧化碳注入结束后30年内持续的水循环方案中,注入井位于地层的上倾角,生产井位于下倾角,可将羽流尺寸减少18%。
Executive Summary
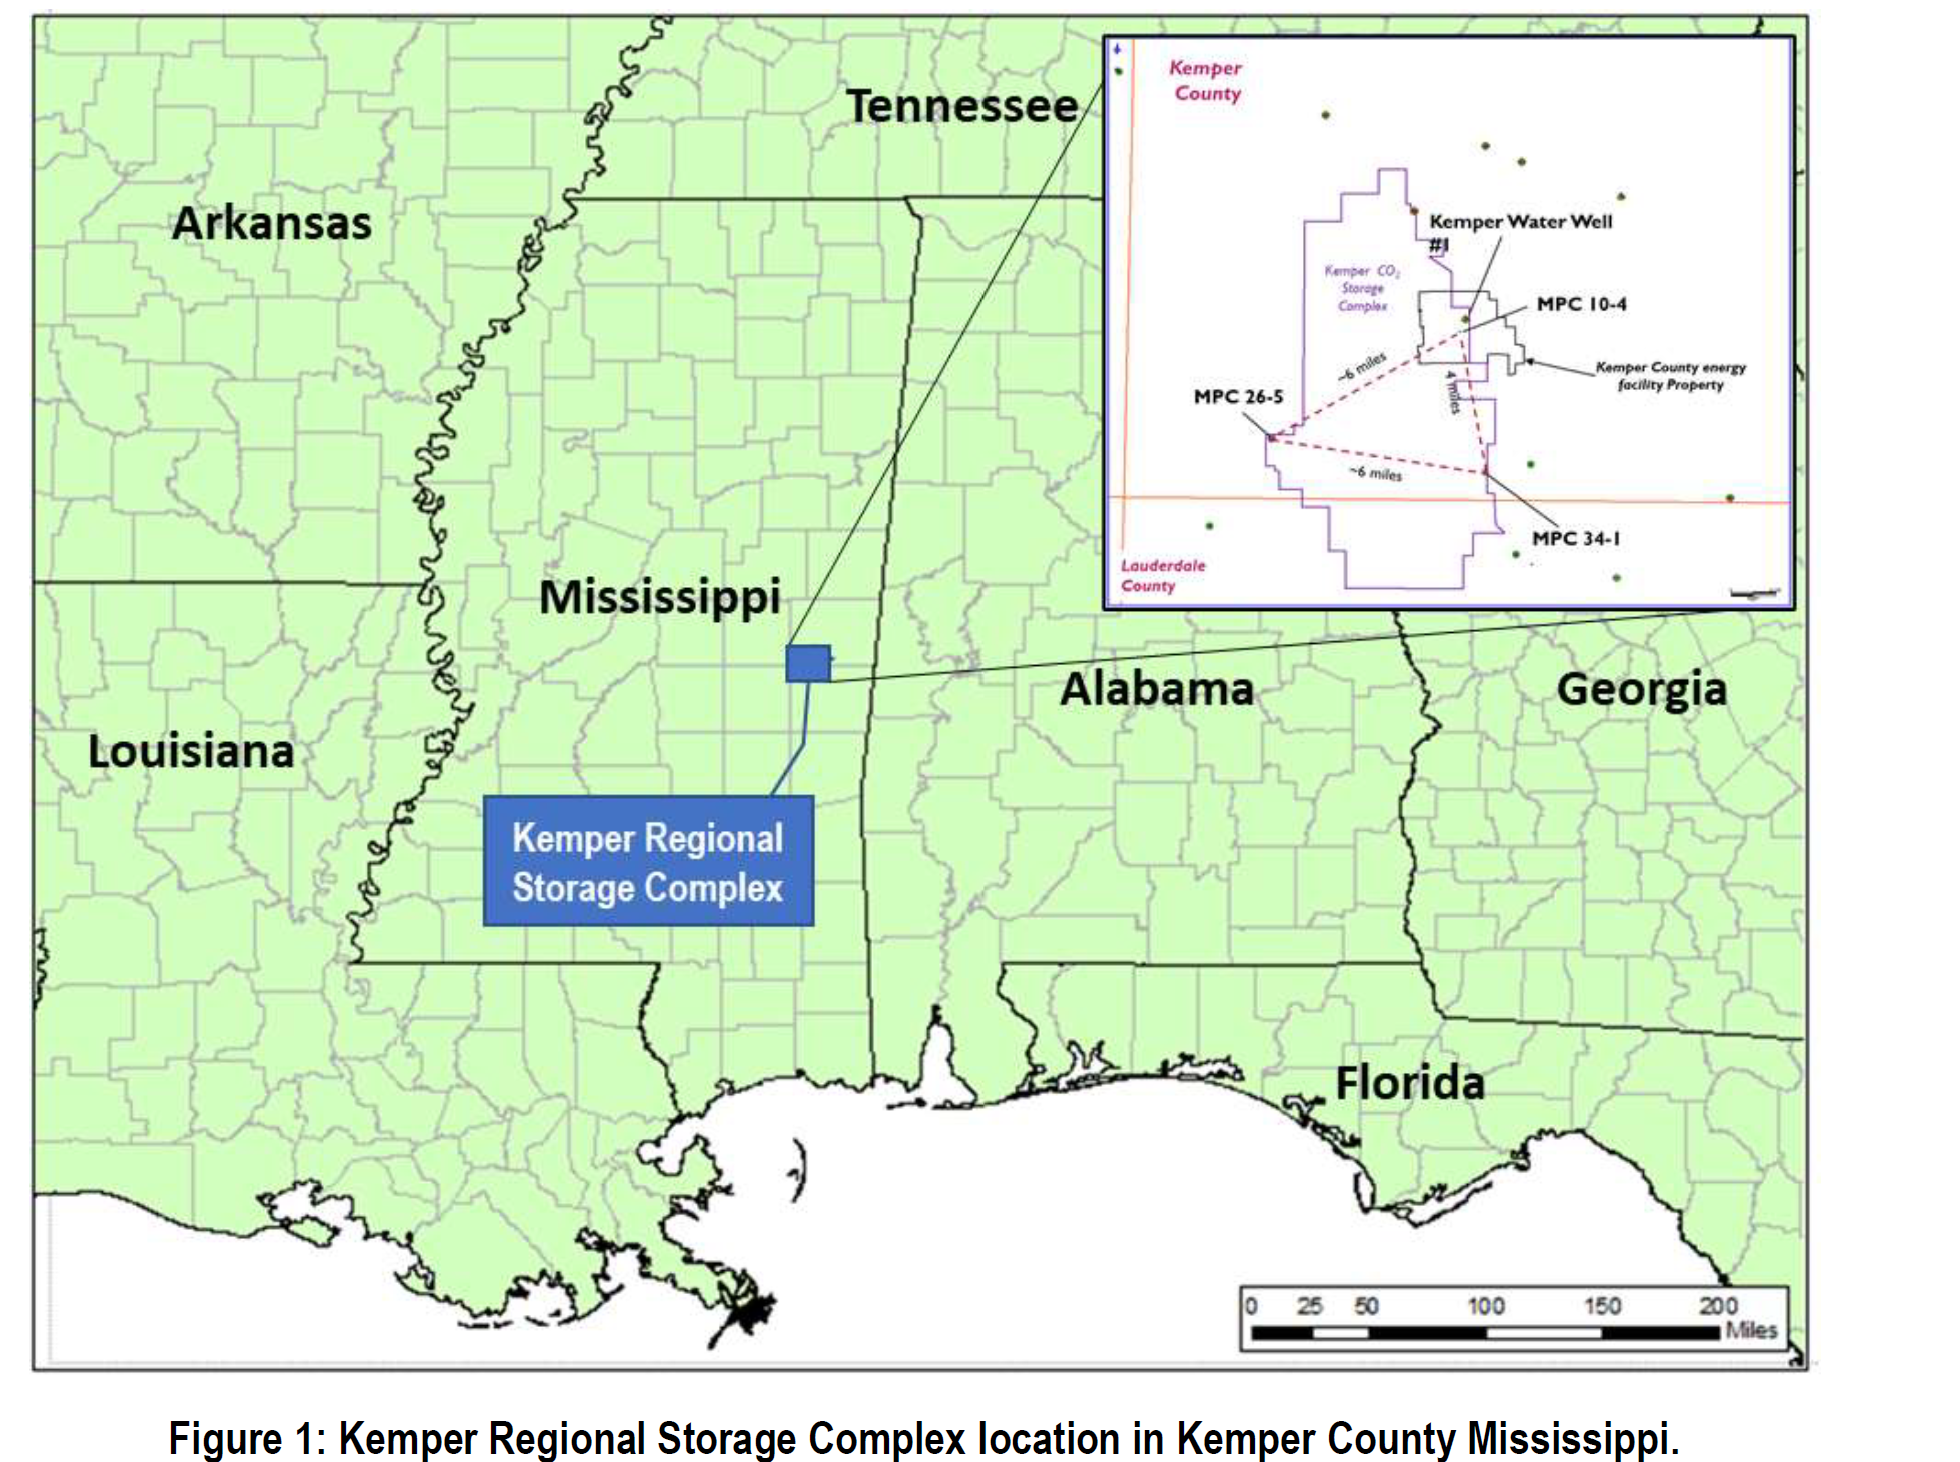
This report summarizes a reservoir simulation study on the CarbonSAFE Project ECO2S Kemper Regional Storage Complex to understand how it can be developed and operated to accept a yearly volume of 22.5 million metric tons of carbon dioxide, captured and transported from three power plants. These sources are the gas-filled units of Plant Ratcliffe (with 0.7 MMmt of annual carbon dioxide emissions) and Plant Daniel (3.0 MMmt/yr), and the coal-fired units of Plant Miller (18.8 MMmt/yr), totaling 22.5 MMmt/yr of carbon dioxide or 675 MMmt over 30 years.
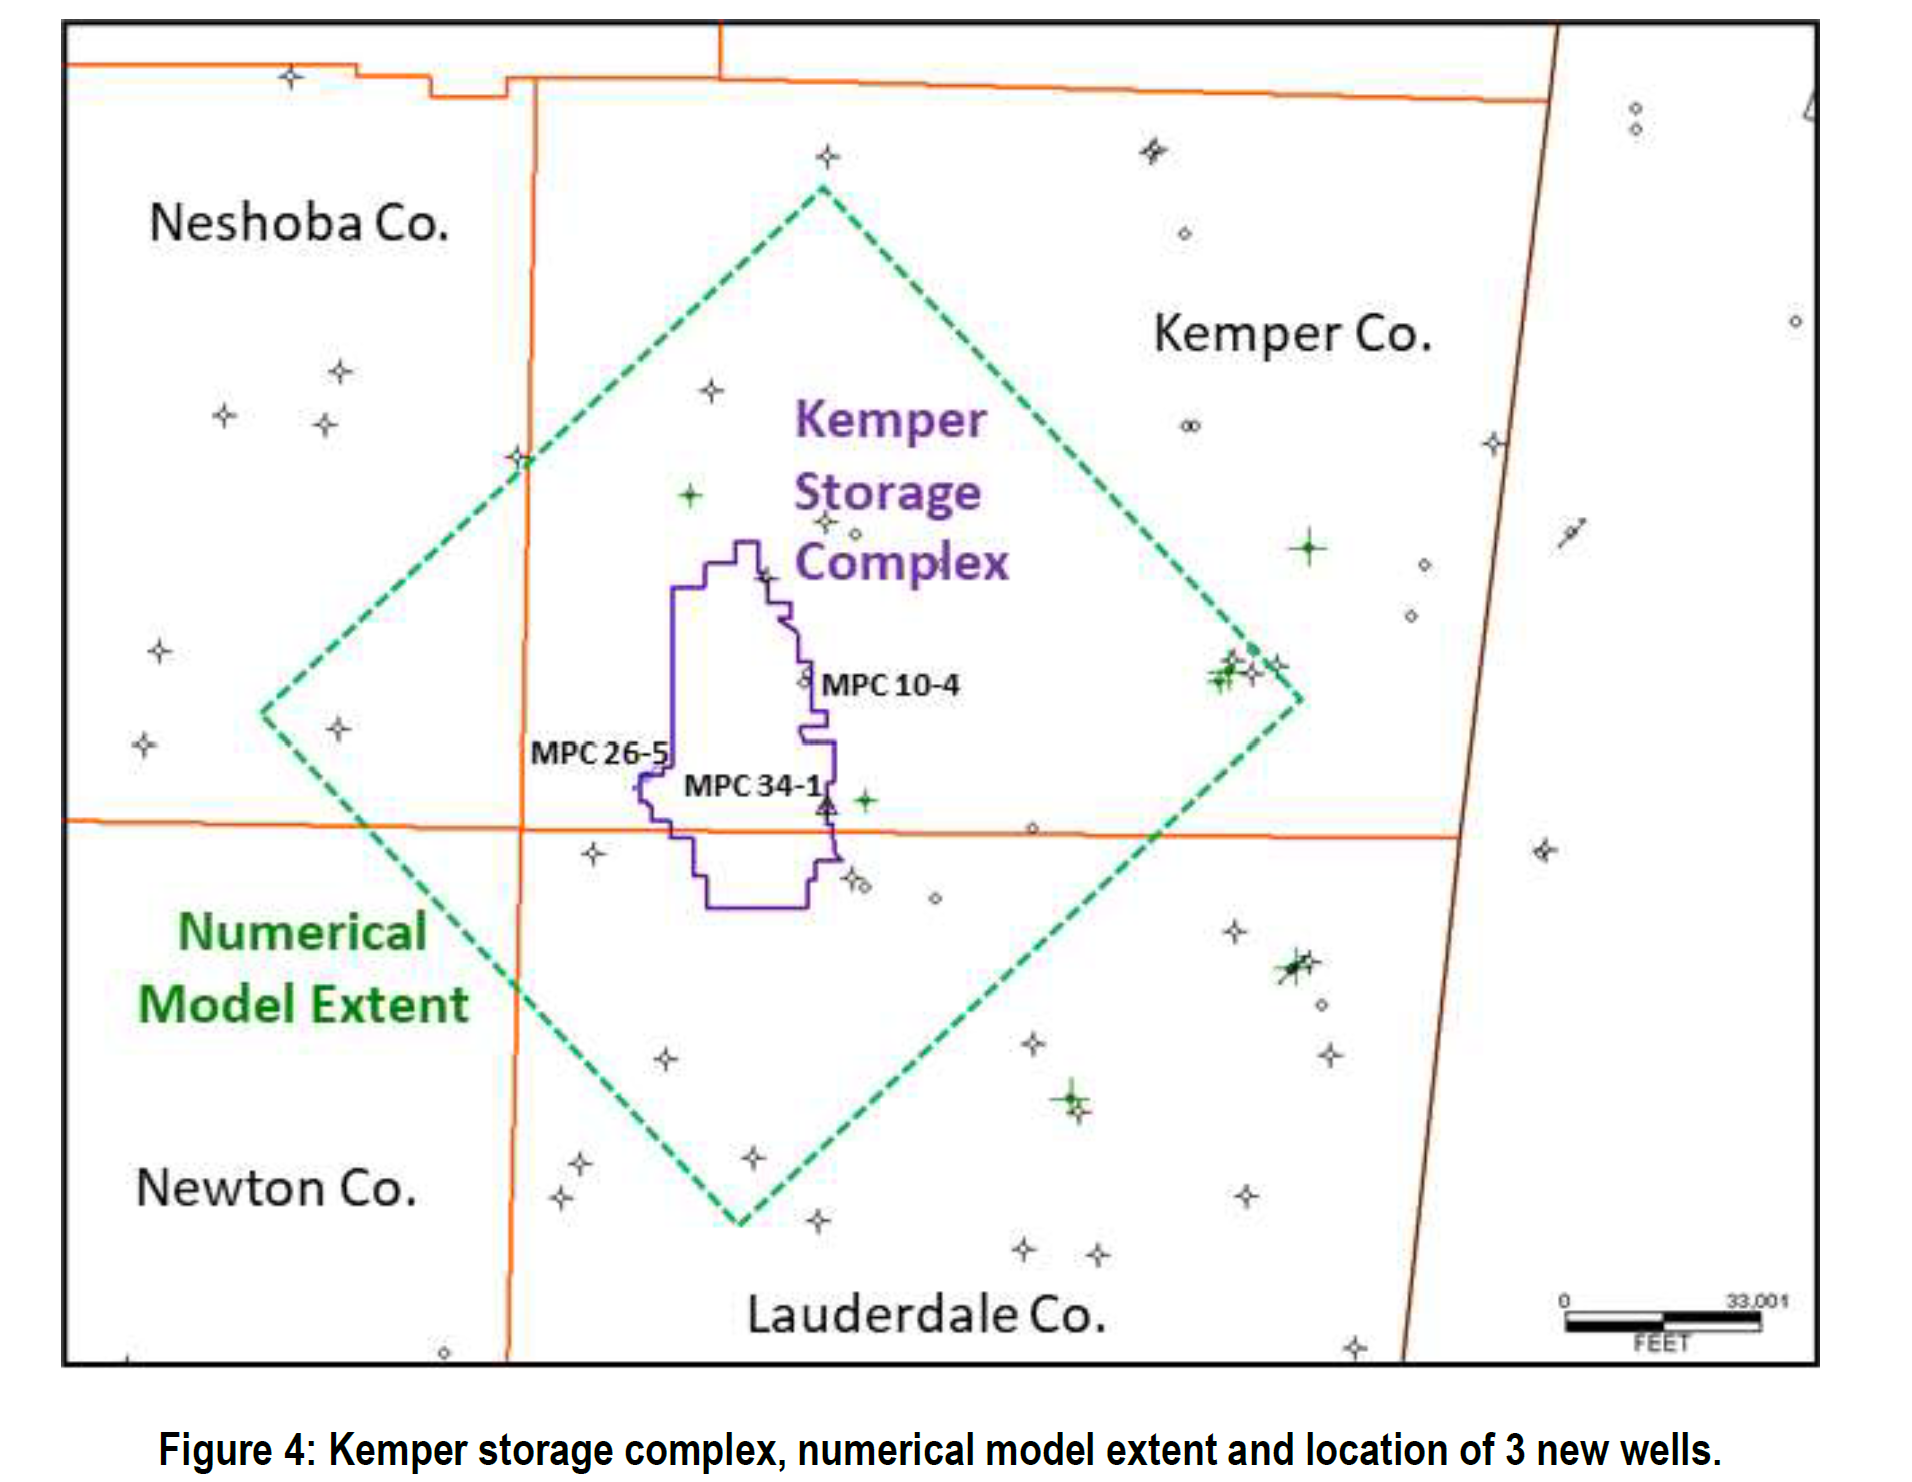
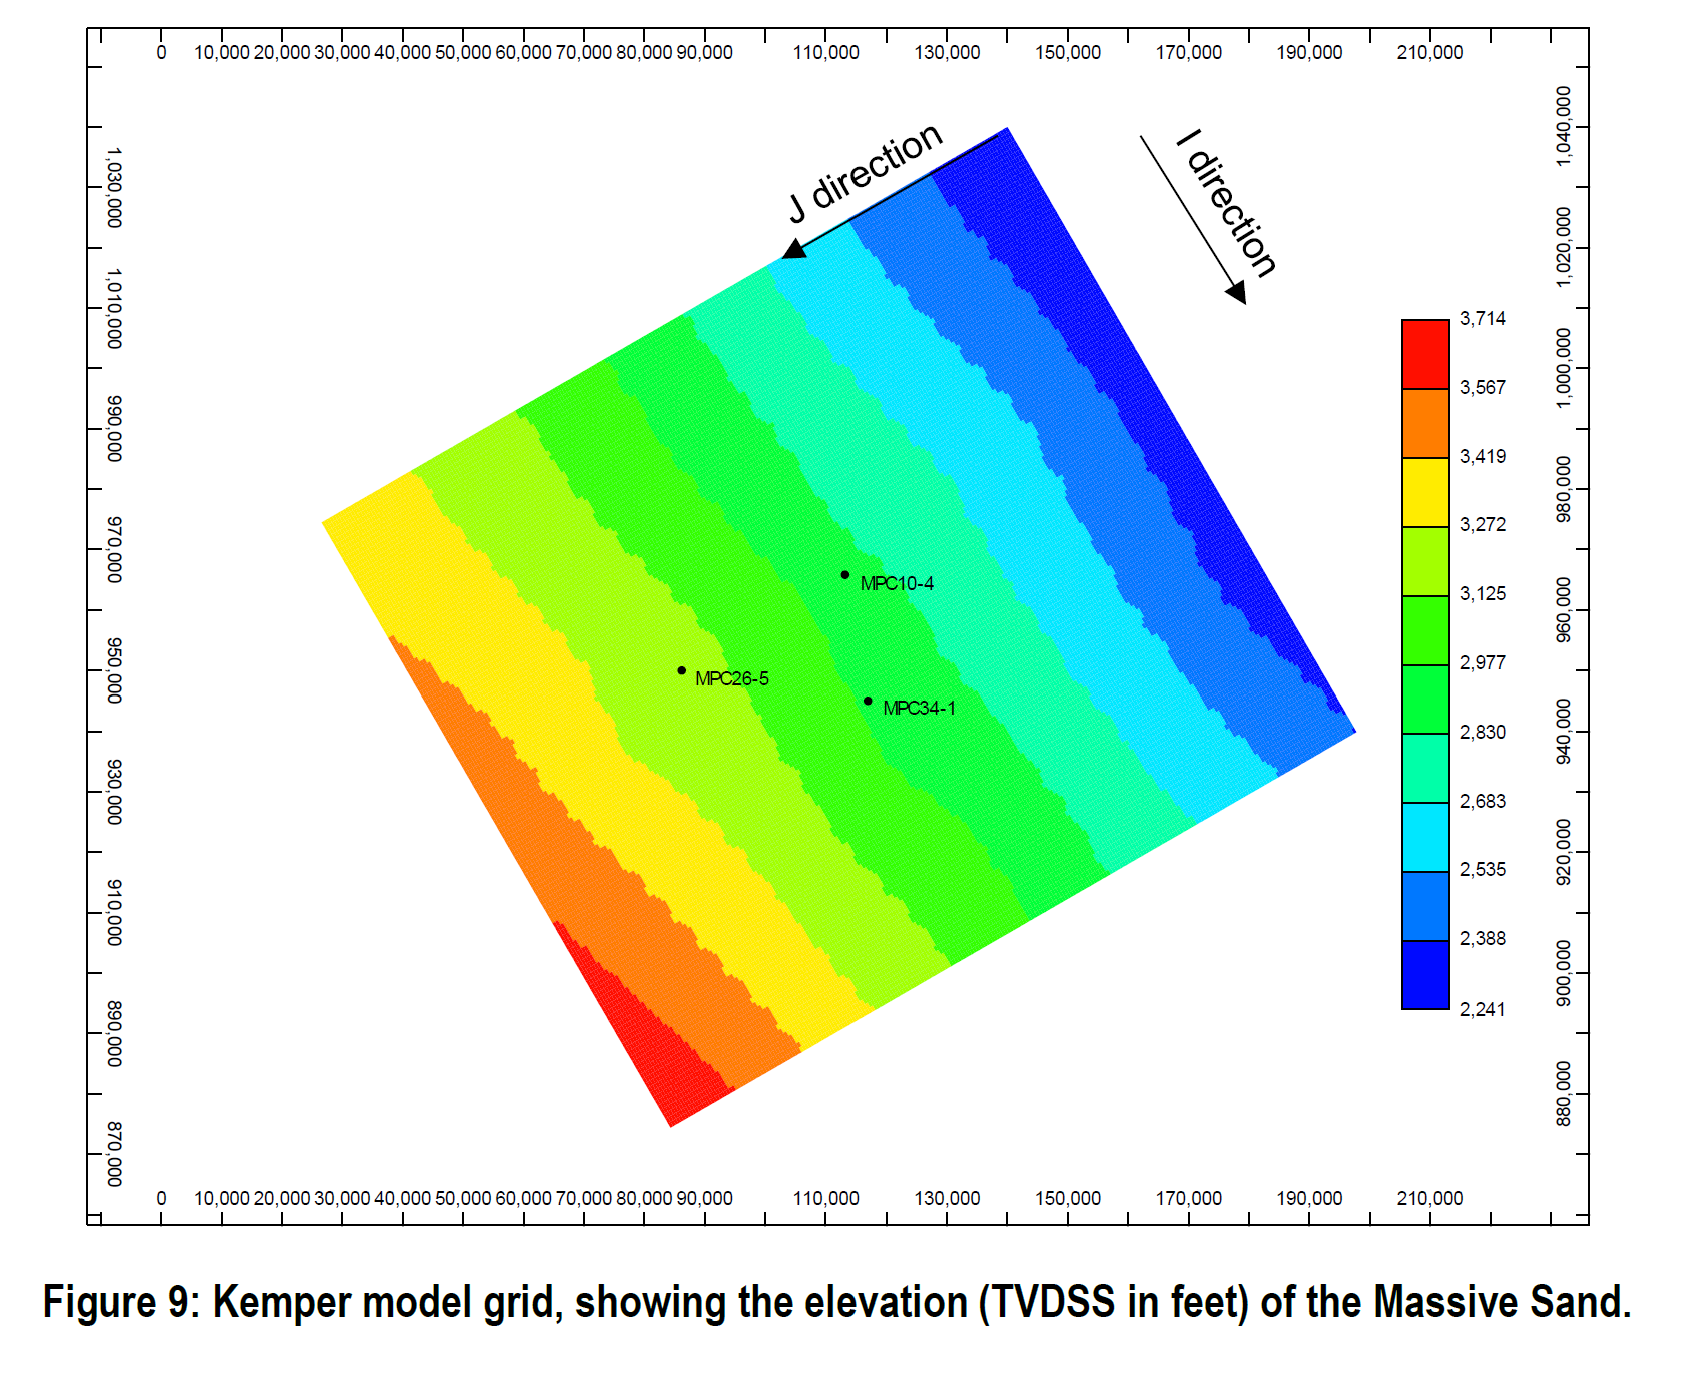
With such a significant volume of CO2, this effort centered on how the plume would develop and how it may migrate, based on the current geological understanding. Of further interest was whether the plume size and direction could be minimized and/or more quickly immobilized through active plume management using water cycling techniques. A base simulation model was developed utilizing the latest geological interpretation of the saline storage formations, the Lower Tuscaloosa Massive sand, the WashitaFredericksburg Dantzler and ‘Big Fred’ intervals, and the Paluxy. The data collected from the three Phase II wells were incorporated in the geological model for further refinement within the project site. Porosity-permeability transform functions were developed for these groups of reservoirs using log and core data.
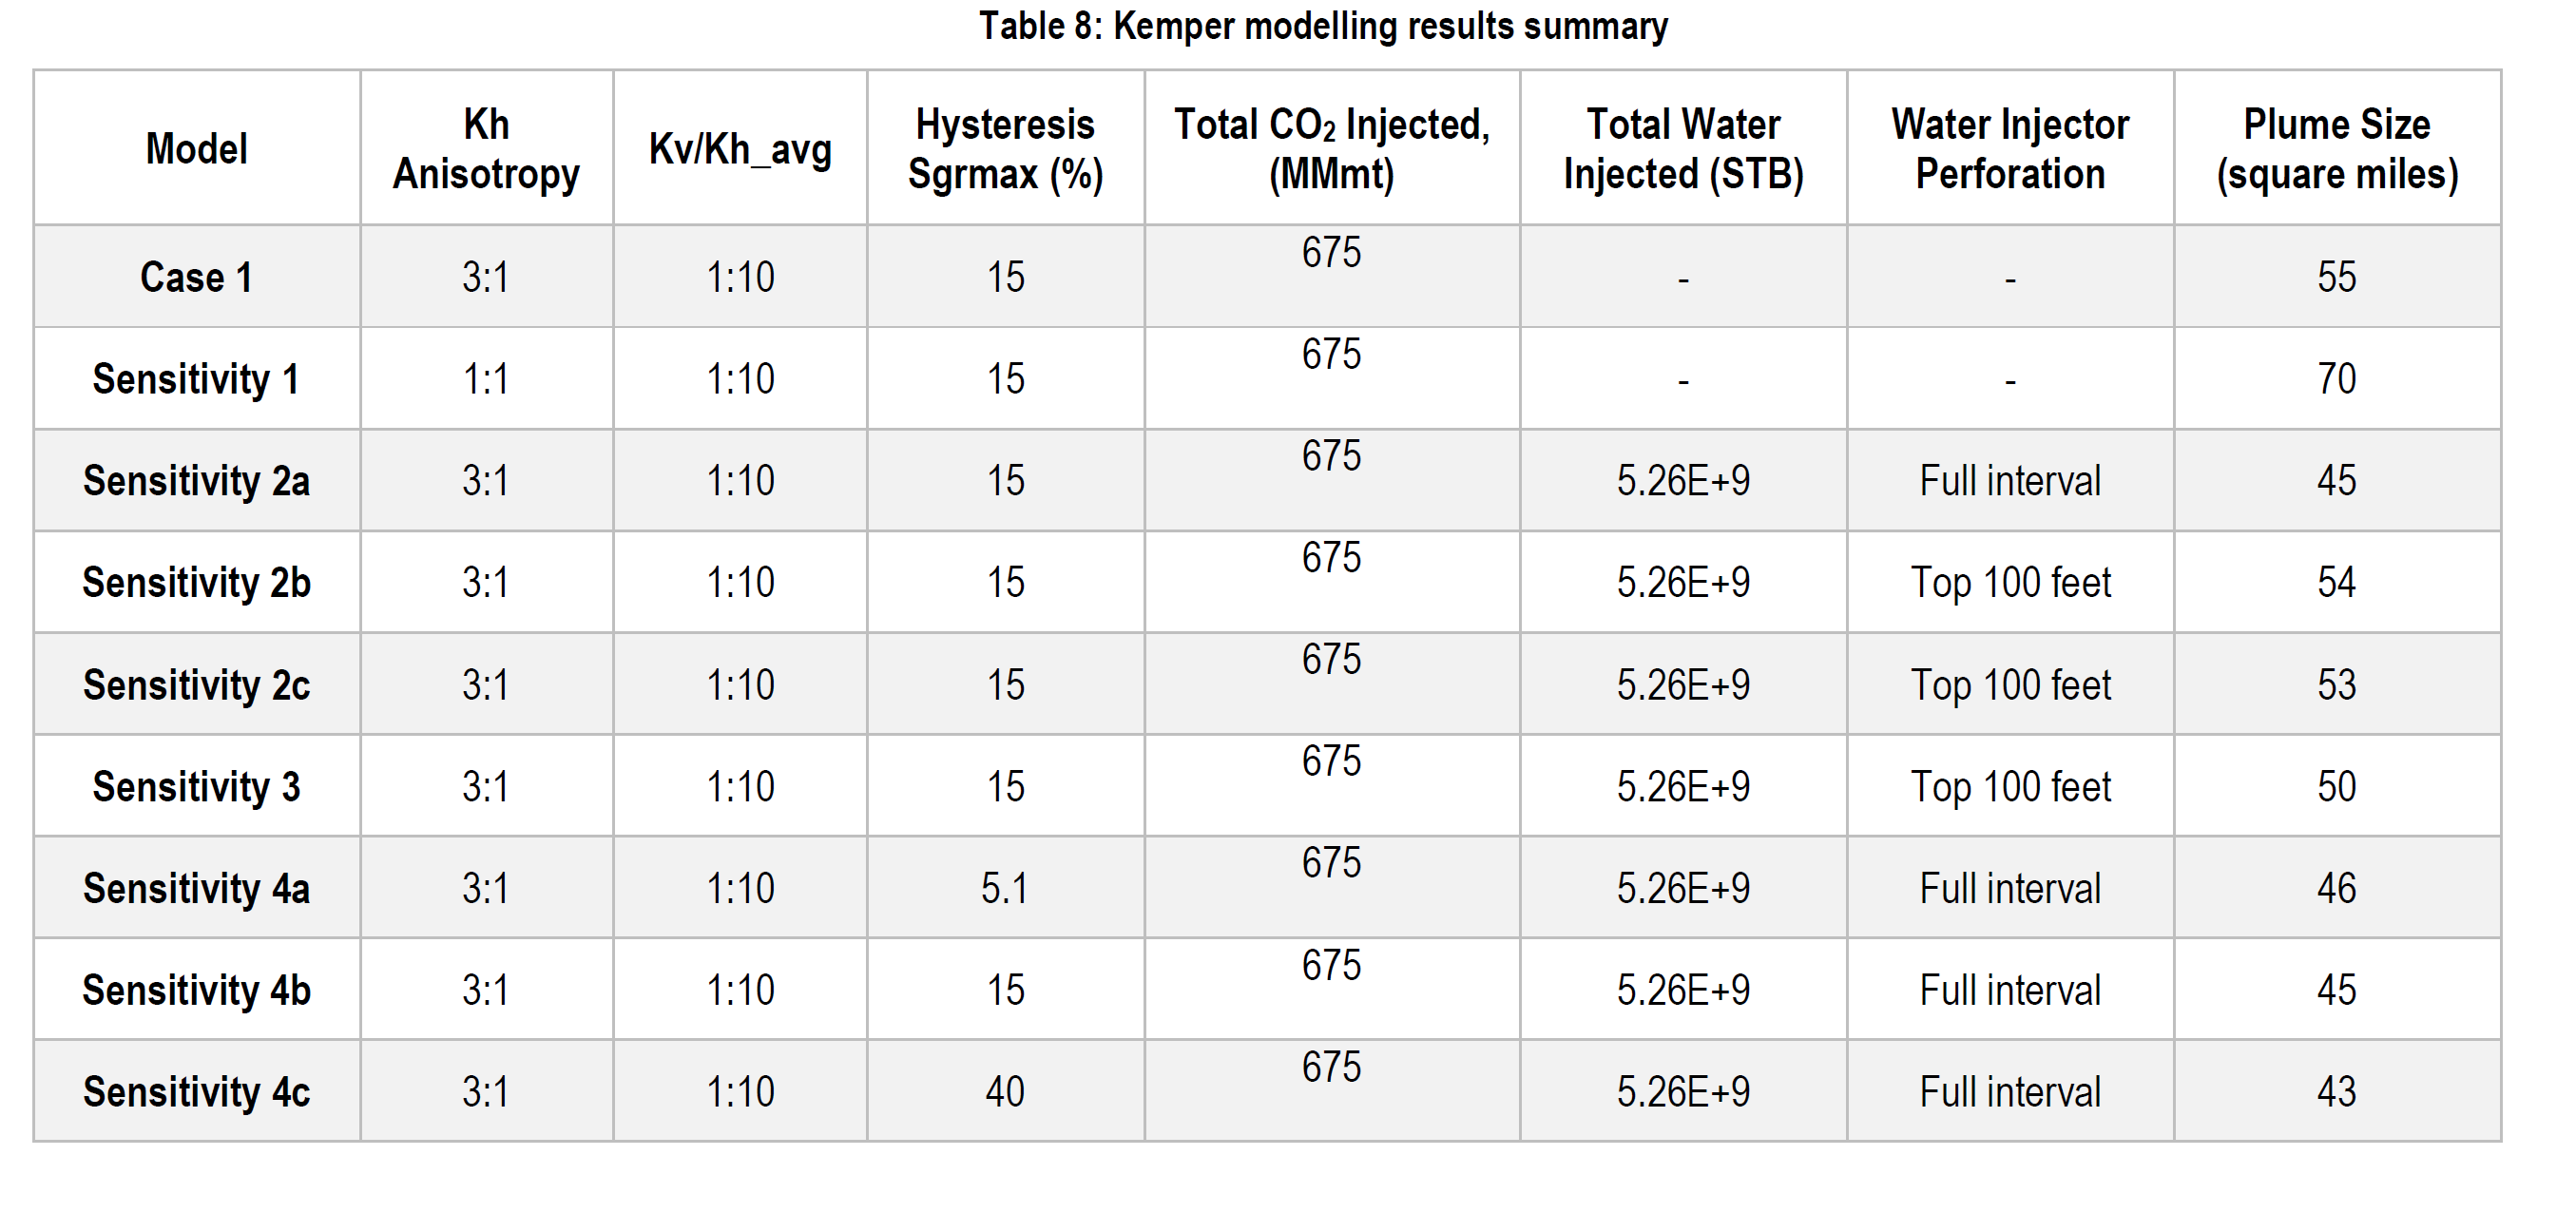
The base model contains 21 carbon dioxide injection wells, located on seven well pads. Each well on a given pad is perforated in only one reservoir group, Massive sand/Dantzler (combined), Big Fred, or Paluxy zones. In other words, each reservoir group receives carbon dioxide through seven injection wells. If the total carbon dioxide daily injection rate were uniformly distributed among the three reservoir groups, the resulting carbon dioxide plume would be vastly different due to differences in rock properties, salinity, reservoir temperature and pressure. To get similar plume extents, different injection volumes were selected for each reservoir group. This arrangement resulted in the Massive sand formation getting the least and the Paluxy formations the most injection volume. The final carbon dioxide plume extent was approximately 55 square miles,
Sensitivity analysis on horizontal permeability anisotropy and hysteresis trapping gas saturation shows their impact on the plume size, changing it by as much as 27% over the base model assumptions, 30 years after the end of CO2 injection. Water cycling was also studied in this model to see its impact on controlling the plume migration. Placement of water injection and production wells at a distance from the carbon dioxide injection wells and at different sides of the site were tested. Twelve water production wells (four assigned to each reservoir group) placed on four well pads would each extract 20,000 bbl/day of water. Twelve injection wells then re-inject the produced water through another part of the reservoir. A water cycling scenario, with the injectors on the up-dip of the formation and producers on the down-dip, that starts at the same time as the carbon dioxide injection and continues 30 years after the end of carbon dioxide injection could reduce the plume size by 18%.